California Poverty:
Basic Statistics

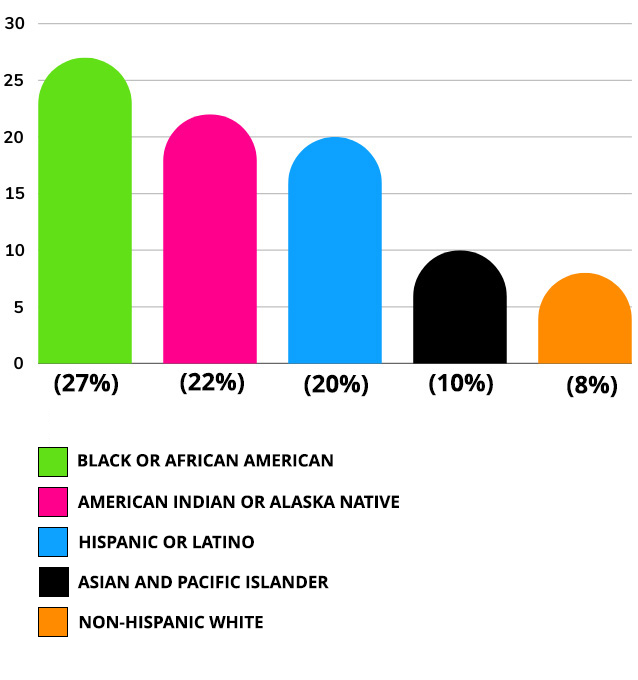
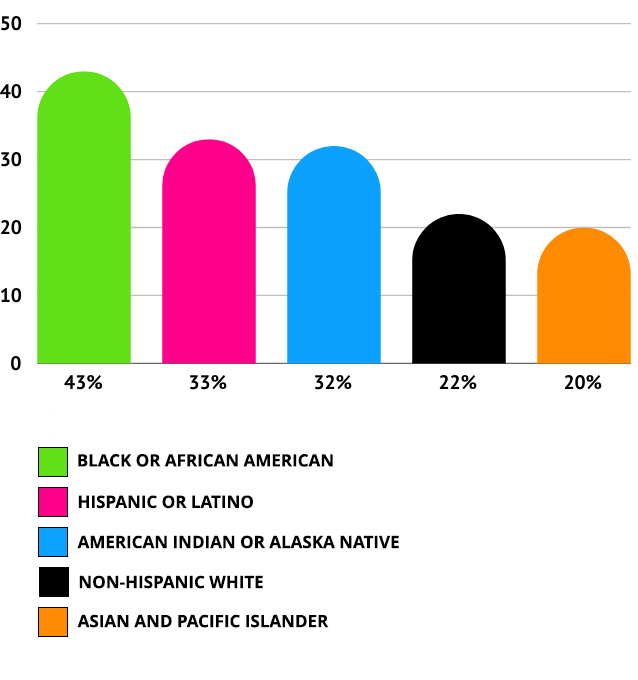
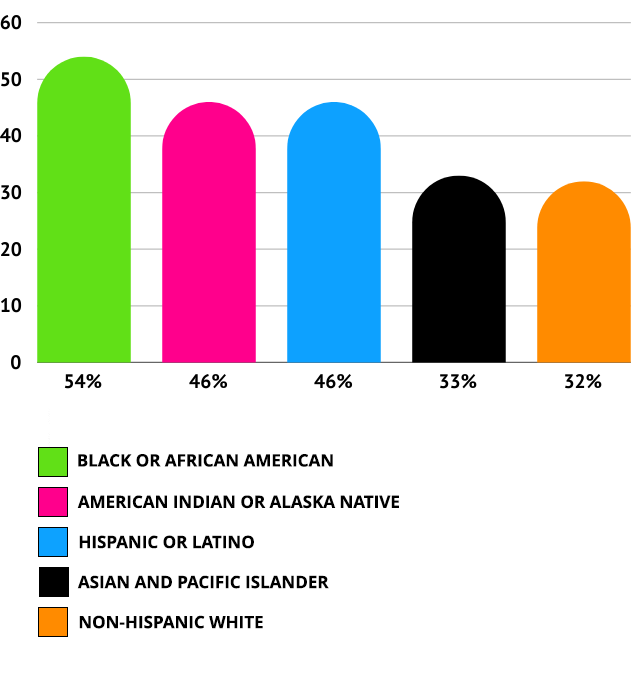
Children in Poverty by Demographic
Source: 2024 KIDS COUNT Data Book
Children in Poverty (2022)

Children Whose Parents Lack Secure Employment (2022)

Children Living in Households with a High Housing Cost Burden (2022)

Poverty Profile
- California has the highest rate of poverty at 13.2% of any state in the U.S. (3-year average, 2020-22) 1
- An average of 5,142,000 Californians lived in poverty from 2020-22, larger than the total population of 27 individual states 1,22
- 16.9% of Latinos in California lived in poverty in early 2023. 2
- 13.6% of African Americans in California lived in poverty in early 2023. 2
- 11.5% of Asian Americans/Pacific Islanders in California lived in poverty in early 2023. 2
- 10.2% of whites lived in poverty in early 2023. 2
- 22% of people with disabilities in California lived in poverty in 2021. 4
- 31.1% of all California residents were poor or near poor in early 2023. 2
Senior Poverty
- 15.2% of seniors in California lived in poverty in early 2023. 2
Food Insecurity
- Over 4.1 million Californians, including 1 in 10 people, and 1 in 7 children, face hunger. 6
Housing and Homelessness
- An estimated 171,000 Californians were experiencing homelessness as of early 2022. 7
- California has only 32 affordable housing units for every 100 renter households, and only 24 for every 100 renters with extremely low incomes. For the latter there is a shortage of nearly 1 million units. 8
- Fact: If housing costs had remained steady since 2013, 800,000 fewer Californians would be in poverty. 9
The Safety Net
- In early 2023, an estimated 3.2 million more Californians would have been in poverty without safety net programs, including the EITC and CTC, CalFresh, housing subsidies, and Supplemental Security Income. 2
- Without existing safety net programs, California’s poverty rate would have been 8.4% higher in early 2023, and 14.9% higher for children. 2
- Without the safety net in early 2023, poverty would be 14.4 points higher in the Central Valley and Sierra; 4.3 points higher in the Bay area. 2
Income and Wealth Inequality
- 186 billionaires live in California — more than any other state in the U.S., and more than any other country outside of the U.S. and China. 11, 12
- California is the fifth largest economy in the world when measuring GDP, yet nearly 3 out of 10 Californians are living below or near the poverty line. 2, 16
- The gap between high- and low-income families in California is among the largest in the nation—exceeding all but three other states in 2021.18
- Black and Latino families make up 12% of those with incomes above the 90th percentile, despite comprising 44% of all families in California; they also comprise 56% of the lowest-income families. 18
- 20% of all net worth is concentrated in the 30 wealthiest zip codes, home to just 2% of Californians. 18
- For every $1 that white families earn, Black families earn $0.60 and Latino families earn $0.52. 18
- Nationwide, the typical (median-wealth) white family has more than six times the wealth of a typical African American and five times more than the typical Latino family. 19
- Latinas earned 51 cents for every dollar earned by non-Hispanic white men in California. Latinas with a bachelor’s degree earned even less: 42 cents for every dollar earned by non-Hispanic white men with a similar level of education. 20
- In California, for every $1 made by a white male, a Black female makes $0.54 (about two cents more per hour than in Mississippi, and about the same as in South Carolina, both of which have significantly lower costs of living). 21
Sources
- U.S. Census Bureau 2022 Supplemental Poverty Measure
- Public Policy Institute of California: Poverty in California
- Stanford Center for Poverty and Inequality
- American Community Survey (U.S. Census Bureau)
- Urban Institute
- Feeding America
- California Budget & Policy Center
- National Low Income Housing Coalition
- Public Policy Institute of California: California’s High Housing Costs Increase Poverty
- Prison Policy Initiative
- World Population Review
- LA Times
- The Orange County Register
- Bureau of Economic Analysis
- World Population Review
- California Budget & Policy Center
- Cal Matters: California’s racial inequality: What can state do with $31 billion?
- Public Policy Institute of California: Income Inequality in California
- CNN
- UCLA Latino Policy & Politics Institute
- Institute for Women’s Policy Research
- U.S. Census Bureau State Population Totals, 2020-2022